Sales & check-in reports
you want the numbers - how many tickets sold, how much you earned, and how many people actually showed up.
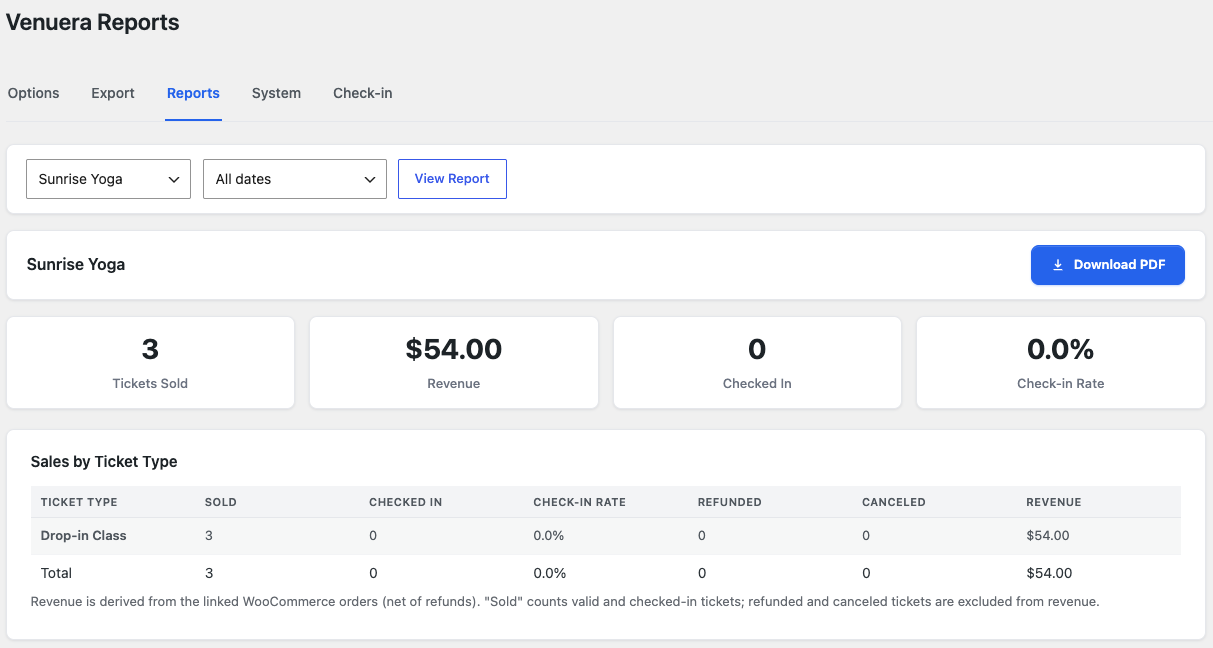
Venuera summarises each event’s performance from your real orders, so you don’t have to add anything up by hand. You’ll find it under Venuera → Settings → Reports, for a whole event or a single occurrence.
Sales
For any event you can see tickets sold and revenue – overall and broken down by ticket type. Revenue is the net amount from the linked WooCommerce orders (excluding tax, after refunds; HPOS-safe), so nothing is faked. Refunded and cancelled tickets are tracked separately and excluded from sold counts and revenue. Because every sale is a WooCommerce order, the standard WooCommerce → Reports / Analytics screens also work and let you slice by date range, product and more.
Check-in / attendance
The report shows how many tickets were checked in and the check-in rate (checked-in ÷ sold) – both for the event as a whole and per ticket type. For a recurring series the figures are per occurrence, so you can compare attendance across dates.
For live counts during the event, the Check-in app shows sold, checked in and remaining at the top of its scan screen, updating as people are admitted.
Door staff vs. organiser figures
If you use the POS, its shift reports add a third view: what each cashier took, broken down by payment method (cash and card) per shift, for reconciling the till at the end of the night.